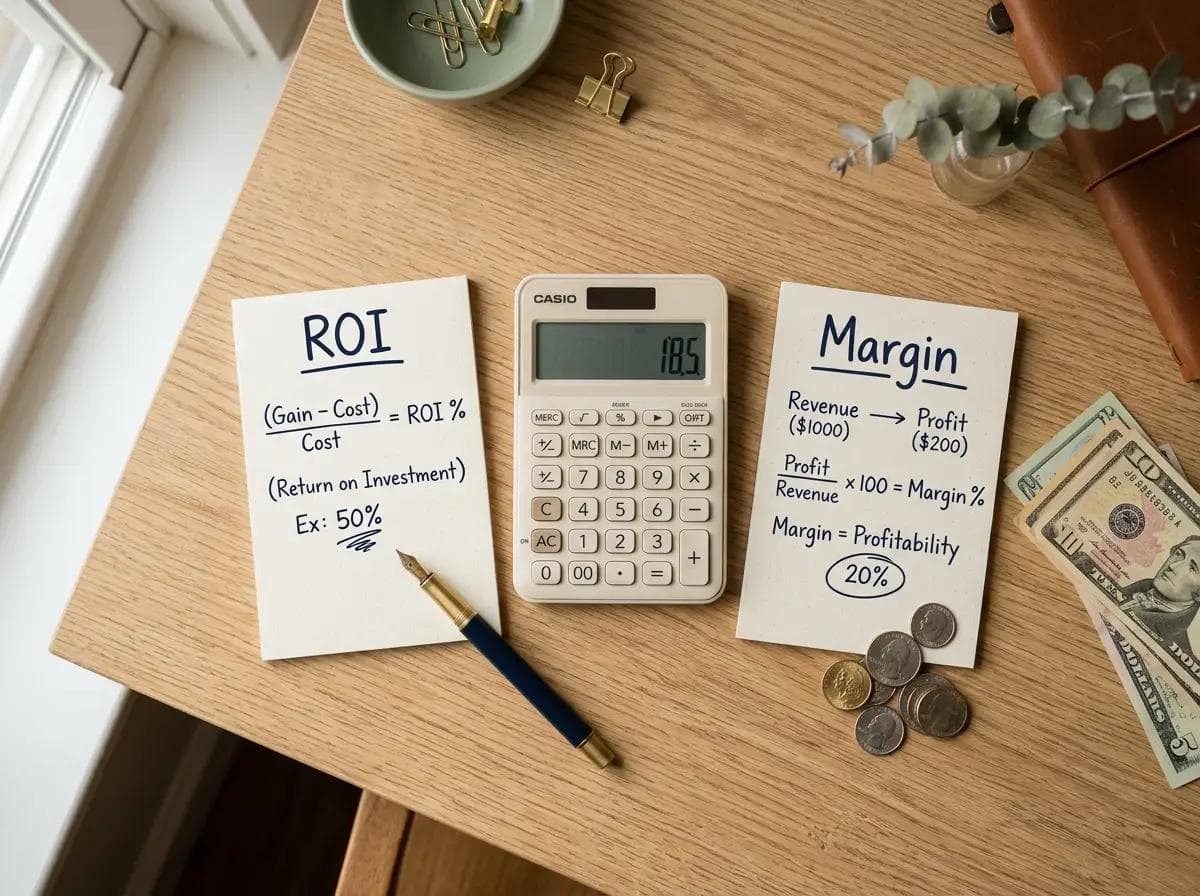
ROI and profit margin are the two most commonly confused financial metrics in business. They're related but not interchangeable. Return on Investment (ROI) answers: "How much did I get back relative to what I put in?" Profit margin answers: "How much of every dollar of revenue did I actually keep?" A luxury goods business with 40% net margins but $50M in inventory and property requirements might generate only 8% ROI. A vending machine business with 12% net margins on $200K invested capital might generate 60% ROI. Knowing which metric to use — and when to use both together — is the foundation of sound financial decision-making.
According to Professor Aswath Damodaran's January 2026 industry dataset at NYU Stern School of Business, the average gross margin across 27 manufacturing subsectors is 33.6%, while the average net margin is just 7.2% — a 26-point gap that shows how much revenue is consumed by operating expenses before reaching the bottom line. This gap, and what causes it, is exactly what profit margin analysis is designed to reveal.
See the difference yourself with our free ROI Calculator →
ROI vs. Profit Margin: Side-by-Side Comparison
| Factor | ROI (Return on Investment) | Profit Margin |
|---|---|---|
| What It Measures | Efficiency of capital deployed | Efficiency of revenue conversion |
| Core Question | "Was this investment worth making?" | "How profitable is this business or product?" |
| Formula | (Net Return − Cost) ÷ Cost × 100 | Net Profit ÷ Revenue × 100 |
| Inputs Required | Investment cost + net return (gain minus cost) | Revenue + relevant costs (varies by margin type) |
| Expressed As | Percentage return on invested capital | Percentage of revenue retained as profit |
| Time Dimension | Can be annualized across any period | Typically measured per period (monthly, annual) |
| Capital Sensitivity | High — heavily affected by how much was invested | Low — doesn't account for capital deployed |
| Revenue Sensitivity | Low — only cares about net return vs. cost | High — every dollar of revenue affects the ratio |
| Best Used For | Comparing investment opportunities; go/no-go decisions | Benchmarking business health; pricing efficiency |
| Biggest Blind Spot | Ignores capital structure and risk | Ignores how much capital was required to earn the margin |
| Industry Benchmark Context | S&P 500 ~10% annualized; marketing 200%+; equipment 33–50%/yr | Varies widely: retail 2–5%, SaaS 20–40%, consulting 15–30% |
| Calculators | ROI Calculator | Profit Margin Calculator |
What Is ROI?
ROI measures how much you earned relative to how much you spent — expressed as a percentage of the original investment, regardless of how large or small the revenue was.
ROI Formula:
ROI = (Net Return − Investment Cost) ÷ Investment Cost × 100
Where Net Return = final value of the investment (or revenue generated) minus Investment Cost.
Worked Example:
You invest $8,000 in a digital marketing campaign that generates $22,000 in attributed revenue at a 40% gross margin, yielding $8,800 in gross profit.
- check_circleNet Return = $8,800 − $8,000 = $800
- check_circleROI = $800 ÷ $8,000 × 100 = 10% ROI
For investments held over multiple years, annualized ROI removes the time variable:
Annualized ROI = [(1 + ROI)^(1/years)] − 1
On a $50,000 equipment purchase that generates $85,000 in cumulative net profit over 4 years, the simple ROI is 70% but the annualized ROI is 14.3% — a more useful figure for comparing against alternative investment options.
Calculate your ROI instantly →
What Is Profit Margin?
Profit margin measures what percentage of revenue a business retains as profit after accounting for specified costs — and there are three distinct types that tell different parts of the profitability story.
The margin type you use depends on which costs you're measuring. Each one answers a different question:
| Margin Type | Formula | What It Tells You |
|---|---|---|
| Gross Margin | (Revenue − COGS) ÷ Revenue × 100 | Profitability of core product/service before overhead |
| Operating Margin | (Revenue − COGS − Operating Expenses) ÷ Revenue × 100 | Profitability of the business before interest and taxes |
| Net Margin | Net Income ÷ Revenue × 100 | True bottom-line profitability after all costs |
Quick example on $500,000 revenue:
- check_circleCOGS: $200,000 → Gross Margin: 60%
- check_circleOperating Expenses: $150,000 → Operating Margin: 30%
- check_circleInterest + Taxes: $50,000 → Net Margin: 20%
Each step reveals a different efficiency problem. A business with 60% gross margin but 5% net margin has an overhead or financing problem, not a product pricing problem. Profit margin analysis locates exactly where revenue is leaking.
Calculate your profit margin instantly →
Why a High-Margin Business Can Have Terrible ROI — and Vice Versa
ROI and profit margin can diverge dramatically because one measures capital efficiency and the other measures revenue efficiency — and they're completely independent dimensions.
This is the most important distinction between the two metrics, and the one most often missed.
The Divergence in Action:
| Business A | Business B | |
|---|---|---|
| Annual Revenue | $5,000,000 | $800,000 |
| Net Profit Margin | 25% | 8% |
| Net Profit | $1,250,000 | $64,000 |
| Capital Invested | $15,000,000 | $120,000 |
| ROI | 8.3% | 53.3% |
| Verdict | High margin, poor ROI | Thin margin, excellent ROI |
Business A looks impressive on a margin basis — 25% net margin is exceptional. But it required $15M in capital (real estate, equipment, inventory) to generate that profit. Business B looks thin — 8% net margin is modest. But it required only $120K in capital to run. Business B's owners earn 53.3% on their investment; Business A's owners earn 8.3%.
An investor analyzing only profit margin would choose Business A. An investor analyzing only ROI would choose Business B. An investor using both metrics correctly would ask: "Which capital structure and risk profile do I want to own?" — which is the right question.
When Should You Use ROI vs. Profit Margin?
Use ROI for investment decisions. Use profit margin for operational efficiency decisions. Use both when evaluating a business acquisition or comparing business models.
| Decision Type | Primary Metric | Why |
|---|---|---|
| Should I buy this equipment? | ROI | Compares return on capital deployed |
| Is my marketing spend worthwhile? | ROI (or ROAS) | Measures return per dollar spent |
| Should I acquire this business? | Both | ROI checks capital efficiency; margin checks operational health |
| Is our pricing strategy working? | Gross Margin | Reveals product-level profitability |
| Why is our revenue growing but profits shrinking? | Operating Margin | Identifies overhead or expense creep |
| How do we compare to competitors? | Net Margin | Industry-standard benchmarking metric |
| Is this product line worth keeping? | Gross Margin + ROI | Together reveal product economics |
| Did this project pay off? | ROI | Measures net return on project cost |
Industry Benchmarks: What's Healthy for Each Metric?
"Good" ROI and profit margin are entirely industry-dependent — comparing a grocery chain to a SaaS company on net margin is meaningless.
Profit Margin Benchmarks by Industry (2026)
| Industry | Gross Margin | Operating Margin | Net Margin |
|---|---|---|---|
| SaaS / Software | 70–85% | 10–25% (mature) | 15–40% |
| Consulting / Professional Services | 50–70% | 15–30% | 12–25% |
| E-commerce (established) | 30–60% | 5–15% | 5–15% |
| Manufacturing (avg. across 27 subsectors) | 33.6% | ~12% | 7.2% |
| Retail (brick-and-mortar) | 25–40% | 3–8% | 2–5% |
| Restaurants | 60–70% (food cost basis) | 3–9% | 3–9% |
| Healthcare / Medical | 40–60% | 8–15% | 5–12% |
ROI Benchmarks by Context (2026)
| Investment Type | Benchmark ROI | Notes |
|---|---|---|
| S&P 500 (10-year average) | ~10% annualized | Widely used baseline for opportunity cost |
| Marketing / Digital campaigns | 200%+ (3:1 return) | Industry minimum for sustainable spend |
| Equipment / Capital assets | 33–50% annually | Implies 2–3 year payback period |
| Real estate (commercial) | 8–12% annually | Varies by market and asset class |
| Small business investment | 15–25% annually | Common threshold for go/no-go decisions |
Manufacturing margin data: NYU Stern Damodaran dataset, January 2026.
How Do You Use Both Metrics Together?
Use profit margin to assess operational health and pricing strategy. Use ROI to assess whether the capital required to generate that margin is worth deploying.
The combination tells you three things simultaneously: whether the business model is efficient (margin), whether it's capital-efficient (ROI), and where the biggest improvement lever is.
Full diagnostic framework:
- check_circleHigh margin + high ROI: Excellent business model. Scale aggressively and protect competitive moat.
- check_circleHigh margin + low ROI: Capital-intensive business. Focus on reducing capital requirements (sell assets, improve inventory turns, reduce receivables cycle).
- check_circleLow margin + high ROI: Lean, efficient model. Focus on volume and pricing power; even small margin improvements generate large ROI gains.
- check_circleLow margin + low ROI: Fundamental business model problem. Reevaluate product pricing, cost structure, and capital deployment before scaling.
Related Tools & Resources
- check_circleROI Calculator — Calculate return on investment for any campaign, purchase, or business decision instantly
- check_circleProfit Margin Calculator — Compute gross, operating, and net margin from your revenue and cost figures
- check_circleCompound Interest Calculator — Model how ROI compounds over multi-year investment horizons
- check_circleIncome Tax Calculator — Understand how taxes affect your net margin and bottom-line ROI on business income
Final Thoughts
ROI and profit margin are not competing metrics — they're complementary lenses on the same business. Margin tells you how efficiently your revenue model works. ROI tells you how efficiently your capital works. Using either one alone produces incomplete analysis; using both together reveals the full profitability picture.
Run your own numbers on both calculators. If your margins are healthy but your ROI is disappointing, the problem is capital deployment. If your ROI is strong but margins are thin, volume and pricing are your leverage points. The metrics tell you which problem you're solving.
See the difference yourself with our free ROI Calculator →
Disclaimer
This blog post is for informational purposes only and does not constitute financial, investment, accounting, or business advice. ROI and profit margin calculations depend on accurate input data and consistent cost classification — results may differ based on accounting methods, industry conventions, and individual business circumstances. Industry benchmark figures are sourced from publicly available datasets and represent central tendencies, not targets. Consult a qualified accountant, CFO, or financial advisor for guidance specific to your business.