The total 401(k) savings rate — including employee contributions and employer matches — hit a record 14.4% in Q1 2026 for the first time ever, according to Fidelity Investments data reported by Kiplinger. That's approaching Fidelity's recommended 15% savings rate, but the average 401(k) balance tells a more complicated story: while record numbers of Americans are contributing, the median retirement account balance for all workers is just $87,000 — less than one year of median household income. The goal of this guide is to answer the question most workers actually need answered: not "what's the average?" but "what's the right number for me?"
Calculate your retirement savings with our free 401(k) Planner →
2026 401(k) Contribution Limits: Quick Reference
The fastest answer to "how much can I put in my 401(k) this year" depends on your age and whether your plan has catch-up provisions.
| Age Group | Annual 401(k) Limit | Catch-Up | Total Possible |
|---|---|---|---|
| Under 50 | $24,500 | N/A | $24,500 |
| 50–59 | $24,500 | $8,000 | $32,500 |
| 60–63 (Super Catch-Up) | $24,500 | $11,250 | $35,750 |
| 64+ | $24,500 | $8,000 | $32,500 |
| Combined with employer (all ages) | — | — | $72,000 ($83,250 for ages 60–63) |
Source: IRS Notice 2025-67. New for 2026: If you earned more than $150,000 in 2025, catch-up contributions must be made as Roth (after-tax) rather than pre-tax contributions.
What Is a 401(k) Calculator?
A 401(k) calculator projects your retirement balance by applying compound growth to your contributions over time — showing you whether you're on track, ahead, or behind your retirement income target.
Enter your current balance, annual income, contribution percentage, expected employer match, estimated annual return, and years until retirement. The calculator projects your balance at retirement, then applies the 4% rule — withdraw 4% of your portfolio annually — to estimate how much monthly income your savings can sustain.
Most 401(k) calculators also let you model scenarios: what happens if you increase your contribution from 6% to 10%, delay retirement by two years, or receive a 4% employer match instead of 3%? Each variable shifts the outcome significantly, and the calculator makes those differences concrete rather than theoretical.
Our 401(k) Planner includes compound growth projections, employer match modeling, and a Roth vs. traditional comparison — giving you the complete picture before you adjust your contribution rate.
How Much Should You Save for Retirement?
The most widely cited benchmark is 15% of gross income — including employer match — starting as early as possible.
Fidelity's research-backed recommendation: save at least 15% of your pre-tax income, counting your employer's matching contribution as part of that total. If your employer matches 4%, you need to contribute 11% from your own paycheck to hit 15% combined. If they match 6%, you need to contribute 9%.
The 15% figure is calibrated to support a retirement income close to your pre-retirement standard of living when combined with Social Security benefits — which averaged approximately $1,907 per month in early 2026 for retired workers.
Fidelity's Retirement Savings Benchmarks by Age
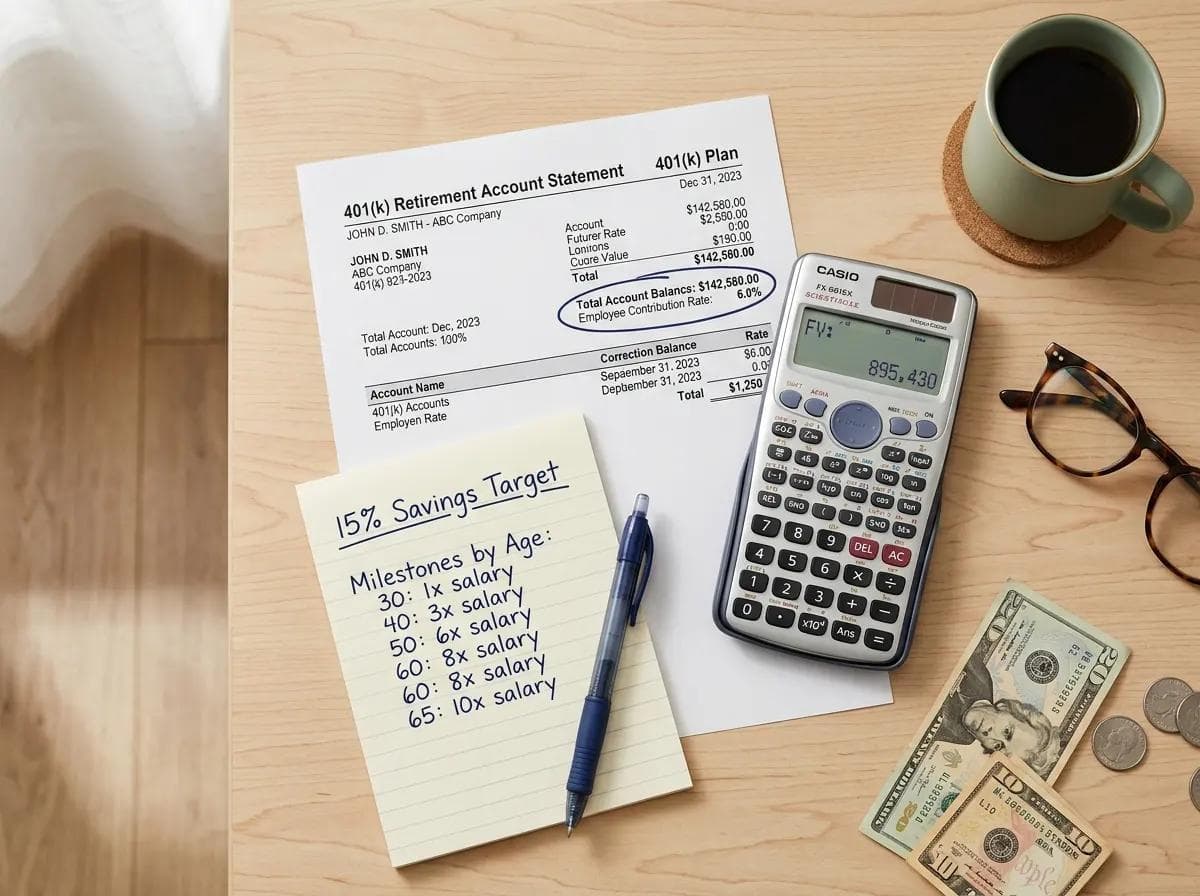
If you can't start at 15%, these salary multiples tell you whether your accumulated balance is keeping pace:
| Age | Savings Target (Salary Multiple) | Why This Milestone Matters |
|---|---|---|
| 30 | 1× annual salary | Proves compounding has started; captures your highest-return decades |
| 35 | 2× annual salary | Mid-decade check; accounts for early career contribution growth |
| 40 | 3× annual salary | Confirms decade of consistent saving; most workers fall short here |
| 45 | 4× annual salary | Pre-peak savings window; catch-up provisions start at 50 |
| 50 | 6× annual salary | Large jump reflects both catch-up contributions and peak earnings |
| 55 | 7× annual salary | Final decade of work begins; Roth conversion window opens |
| 60 | 8× annual salary | Pre-retirement planning window; Social Security timing decisions |
| 67 | 10× annual salary | Full retirement target for standard lifestyle maintenance |
If your current balance is below the multiple for your age, the 401(k) Planner shows exactly what monthly contribution rate closes the gap — and how much time is left for compounding to work.
How Does a 401(k) Contribution Reduce Your Take-Home Pay?
Pre-tax 401(k) contributions cost you less than their face value because they reduce your taxable income — the tax savings partially offset the contribution.
This is the most underestimated benefit of traditional 401(k) contributions. Every pre-tax dollar you contribute lowers your taxable income by the same amount, which means the government effectively subsidizes a portion of your retirement savings.
Worked example: $75,000 salary, 22% federal tax bracket, contributing 10% ($7,500/year or $625/month):
| Factor | Without 401(k) | With 10% 401(k) |
|---|---|---|
| Gross monthly income | $6,250 | $6,250 |
| 401(k) contribution | $0 | −$625 |
| Taxable income (monthly) | $6,250 | $5,625 |
| Federal tax at 22% | −$1,375 | −$1,238 |
| Take-home pay | $4,875 | $4,387 |
| Net cost of $625 contribution | — | $488 (not $625) |
The $625 contribution costs only $488 in take-home pay because it saves $137 in federal taxes. Over a full year, that's $1,644 in tax savings subsidizing $7,500 in retirement savings — a 22% instant return before any market growth.
Model your exact tax savings with our free 401(k) Planner →
Why Is the Employer Match the Highest-Return Investment Available?
Employer matching is an immediate 50%–100% return on the contributed dollar — the only guaranteed return of that magnitude available to most workers.
Most employers match between 3% and 6% of salary at a 50%–100% match rate. Here's what that means in practice: if your employer matches 100% of contributions up to 4% of your salary, contributing 4% generates an immediate 100% return on those dollars before the market moves a cent.
On a $70,000 salary:
| Your Contribution | Employer Match (100% up to 4%) | Total Invested | Immediate Return |
|---|---|---|---|
| 2% ($1,400) | 2% ($1,400) | $2,800 | 100% |
| 4% ($2,800) | 4% ($2,800) | $5,600 | 100% |
| 6% ($4,200) | 4% ($2,800) | $7,000 | 67% |
| 10% ($7,000) | 4% ($2,800) | $9,800 | 40% |
The priority rule: Always contribute at least enough to capture the full employer match before funding any other account. Not doing so is the financial equivalent of leaving part of your salary uncollected. After capturing the full match, direct additional contributions to your 401(k) or a Roth IRA based on your current vs. expected future tax bracket.
How Does the 401(k) Planner Project Your Future Balance?
The calculator applies compound growth to both your contributions and your employer match, reinvested continuously over your working years.
The core formula: A = P(1 + r)^t + [C × ((1 + r)^t − 1) / r]
Where P is your current balance, r is your annual return rate, t is years to retirement, and C is your annual contribution (including match). At a 7% average annual return — a commonly used long-term estimate based on historical diversified portfolio performance — money doubles approximately every 10 years.
What $200/month looks like over time at 7% annual return:
| Starting Age | Retirement at 65 | Years Invested | Final Balance | Total Contributed |
|---|---|---|---|---|
| 25 | 65 | 40 years | $524,000 | $96,000 |
| 35 | 65 | 30 years | $243,000 | $72,000 |
| 45 | 65 | 20 years | $104,000 | $48,000 |
| 55 | 65 | 10 years | $35,000 | $24,000 |
The 25-year-old investing $200/month ends up with 15× more than the 55-year-old investing the same amount — with only 4× more years invested. That multiplier is compound interest, and it's why starting early matters more than any other retirement savings variable.
See your own projection with our free 401(k) Planner → | Model compound growth in detail →
Related Tools & Resources
- check_circle401(k) Planner — Project your retirement balance, model employer match scenarios, and compare Roth vs. traditional contributions
- check_circleCompound Interest Calculator — Understand the math behind your 401(k) projections and model any investment scenario
- check_circleIncome Tax Calculator — See how pre-tax 401(k) contributions reduce your current tax bill and whether Roth or traditional makes more sense for your bracket
- check_circleBudgeting Tool — Find room for higher contributions by mapping your full monthly cash flow
Final Thoughts
The right 401(k) contribution isn't the maximum — it's the amount that captures your full employer match, keeps your current budget sustainable, and grows your balance toward the salary-multiple benchmarks for your age. The record 14.4% total savings rate in Q1 2026 shows most workers are trending the right direction. The $87,000 median balance shows most still have significant ground to cover.
The fastest way to know where you stand and what to do about it is to run your actual numbers.
Calculate your retirement savings with our free 401(k) Planner →
Disclaimer
This blog post is for informational purposes only and does not constitute financial, investment, or tax advice. Retirement projections are estimates based on assumed contribution rates and investment returns — actual returns vary with market conditions. The 4% withdrawal rule is a planning guideline, not a guarantee. 401(k) contribution limits reflect IRS Notice 2025-67 for tax year 2026 and are subject to annual adjustment. Social Security benefit estimates may change based on earnings history and claiming age. Consult a qualified financial advisor or retirement planner before making significant contribution or investment decisions.